.@SamHarrisOrg Perhaps coincidentally, I joined Twitter to defend you from unfair attacks on TYT from the likes of Cenk Uygur & CJ Werleman. Today, I’m using my last thread here to explain why you’ve lost my support as a long-time follower of your work & podcast, Patron, & fan.
The dumbed-down discourse of social media needs more intellectual voices, & less influence from the uncharitable, tribal, childish provocateurs who dominate online culture here. You’d been a firewall against those things, but appear to be succumbing now (as have I, hence leaving).
I think you’re in the process of erecting an echo chamber for yourself. You leap to defend the members of a small clique, while subjecting those outside your tribe to increasingly unfair (or at least, asymmetrical) scrutiny.
Some of your early allies seemed more defensible, but you now look to be using a heuristic based on who is willing to criticize Islam, or poke the PC police. While I fall on the same side of those issues as you, your algorithm needs to be more sophisticated than that.
The way you dealt w/ Christian Picciolini’s (unfair, & maybe outright wrong) claims was the last straw for me, but just one episode in a series of holding the left under a microscope, while lobbing softballs at your establishment center-right peers.
Molyneux is a racist crank, Sam. You don’t need to give his word gospel status. I don’t think he’s a Holocaust denier, either. But, he’s given platform to them w/o challenge to their basic premise, which at least put him on the hook for a public statement.
More importantly, it’s not your job to serve as censor for that dispute. Molyneux can risk losing some of his anti-semitic fans by mounting his own defense here. You can even post his argument, along w/ Picciolini’s, on your blog. Have you run out of pixels now?
Damore did shop his story to questionable right-wing platforms after his (probably unfair) firing. That “exclusively” isn’t correct is a minor point, IMO, & the fuzzy term “alt-right” is flatly not a matter of fact. You don’t apply this word policing to your conservative guests, or even yourself.
You & Douglas Murray tossed around the word “fascist” like it was Halloween candy on your pod. Antifa, despite some being illiberal thugs, are not fascists. That’s not what that term means. I don’t want you to cut it, though, because I believe in free speech & know live convos have rough edges.
On Douglas: he's not wonderful. He’s a paranoid xenophobe w/ Oxford grammar. You seem to mistake his tone for moderation that isn’t there. Also, Mark Steyn isn’t great. He’s a vocal climate change denier, & if people can’t see that issue as vastly bigger than "campus free speech", we're screwed.
On your podcast, Ayaan said (all) women in Europe are not safe anymore (b/c of Muslim immigration). Are you going to fact-check that? We keep crime stats for a reason. You didn't push back one bit.
...
I don't endorse SPLC's list, but she did say we are at war with (all) Islam. She's talked of civil war if Islam's issues aren't addressed. If she's not an extremist, she should stop making such noises.
I’m also a fan of talking w/ opponents, but judgment matters, too. Jordan Peterson is a charlatan. He’s smuggling conservative Christian dogma in through some reasonable psych commentary. I didn’t mind a podcast w/ him. Or, a 2nd trying to clean up the first. But, #3, 4, 5 & 6? What the hell are you doing, Sam?
This doesn’t square w/ you saying you’ll be avoiding the far left because of your run-in w/ Ezra. 1st, he’s not part of the far left (we hate him, too). 2nd, you're using personal anecdotes to judge a wide group. 3rd, you have to see how that breakdown was partly the result of your actions, & picking the final fight w/ Klein.
It’s ok to have boundaries for your podcast platform, but please try to apply them consistently. The left hold views I find odious, too. But, so do folks like Ben Shapiro. Someone who thinks it’s ok to openly claim “arabs” like to live in sewage might reveal a line to draw, if you're pruning out leftists.
You say the left isn’t treating you fairly (ok), but routinely take the opportunity to provoke them. The tweet below 👇 is a recent example, but there’s other things like your quote about Ben Carson (vs Chomsky) as POTUS. How do you expect people to react to exaggerated rhetoric like that?
I think it’s fine to have a laugh in private about the Penis Hoax (I did), but maybe that’s not something you needed to promote. It’s embarrassing that a college professor thought that was a good idea, not to mention the conclusions the authors thought they could draw from it.
I stuck w/ you through the statistically empty gun apologetics, the obfuscation & equivocation on consciousness, the anthropomorphic paranoia about AI, & the strange bromance w/ anti-intellectual meatheads Joe Rogan & Jocko Willink, but you’ve lost me now.
The new fraternity of renegades is too much. Time to stop reflexively defending each other. You might start w/ Rubin. My criticism of you (overfixation on "SJW"s & personal vendettas, asymmetrical charity to outgroups, underdeveloped political IQ) are all worse w/ Dave. If you can’t see it in him, I doubt you'll ever course-correct.
Wednesday, August 9, 2017
Gender Differences and Statistical Distributions
With respect to the recent Google memo, intelligent discussion of the topic may be impeded by bad math being employed by both "sides" of this debate.
First of all, and probably more prevalent, are those who misunderstand the memo author's claim, and are assuming that he's using the average male and average female as proxies for all males and females. He's clearly not, and his memo shows this in notional graph form.
The purple and green lines represent statistical distributions of a given trait (e.g. math skill) distributed over a population. The shape of the purple (women?) and green (men?) distributions are identical in this example, but the green curve is shifted to the right, showing a higher average value for the notional Trait for green (men). Evident in the graph is that even with a higher average, there's a large overlap in the curves, such that for any minimum value of the Trait, there will be some number of men (area under the green curve) and a smaller number of women (area under the purple curve) who have the Trait at that minimum value, or greater.
As a first approximation, the memo goes on to argue that such statistical distributions may explain differing rates of representation among Google's workforce for different genders.
For example, from this link, we see the following data, which has been qualitatively consistent for many years.
If math skill, as measured by an SAT test, correlates well with skills applicable at IT companies, then we might expect those companies to hire more Asian males, Asian females, white males, and white females, in that order, for example. But, of course, the US population is not made up of equal numbers of those four groups. So, it's relevant to compare IT hiring relative to the overall US population. (Note: this certainly ignores the fact that some hiring of foreign workers takes place, but examining that detail isn't necessary now to understand the basic point made in the memo).
Looking specifically at Google, their share of technical jobs held by women stands at 19% (2016), while approximately 32% of those jobs are held by Asian workers, and 57% by white workers. As non-Hispanic whites make up approximately 62% of the US population, this means that whites are slightly underrepresented at Google, still ignoring the math skill results. If we assume that Google gender ratios (.81 : .19) hold across ethnicities, for the sake of argument, that would mean that white men are overrepresented at Google (46%), while white women are underrepresented (11%). White men only make up 31% of the US population, so 46% is considered overrepresentation. However, this effect is much greater for Asian men, who have approximately 26% of tech jobs at Google, compared to 3% of the US population. Likewise, Asian women hold 6% of Google tech jobs, compared to 3% of the population. So, Asian men are employed in Google IT jobs at a level more than 800% of their expected level, based on population alone. Asian women are employed at 200% of their expected level. White men are employed at 150% of expectations, and white women at 35% of expectation.
Qualitatively, these 4 groups' basic results are consistent with the ranking of each of the groups' averages in the SAT math scores table. This is essentially one of the memo's major points - that skewed ethnic or gender representation at Google should be expected.
Limitations
There's multiple problems with the memo's content, as well as the simplified example I provided above. One problem is that the SAT math scores, and the notional graph of Trait distributions that the memo showed, are both indications only of gross population features. The published results of the tests may simply be averages (as shown in the table above), or perhaps an average and standard deviation, for a normal distribution. But, these two numbers and a distribution type (e.g. "normal") are only a rough approximation of the entire distribution. In reality, distributions of traits can have shapes unlike the ones shown in the notional memo graph above. For some analyses, this may be irrelevant, and a normal distribution may adequately describe the results.
There's reason to suspect, however, that Google's IT workforce may be an exception here. IT staff in general are not drawn from an entire population. In terms of a trait like math skill, they will generally only be from the upper echelons of ability, likely all above the average. For Google, specifically, though, the staff are likely to come exclusively from the very highest performers in our measured traits. Consider these new notional distributions.
In the above graph, I've represented male (blue) and female (pink) math scores with overlapping distributions. The male graph has a higher average math score. For most minimum values of "mathiness" one could pick, there is a greater area under the blue curve than under the pink curve, suggesting that we should expect more men than women to meet that minimum criterion. However, recall that Google isn't sourcing employees from near the average. The "upper tail" of a distribution (aka "right tail") is the part of the curve at the highest values on the X (Mathiness) axis. I have shown a possible zoomed-in view of that portion of the curves in a second plot:
This is completely hypothetical. However, what it attempts to illustrate is that since Google is an elite employer, they are interested in an area of the distributions that may not be well-represented by the overall male-female distributions shown first. It's entirely possible, for example, that the male distribution is not strictly normal. It may not be symmetric to the left and right of the average point (and I have drawn it to be asymmetric). If this is the case, while most parts of the male mathiness curve exist at higher values of mathiness than the female curve, the curves may cross near their upper tails. If so, it may be expected that for very high minimum values of mathiness (i.e. Google's elite standards), we would see more women than men meeting that criterion. This is depicted in my second (zoomed) graph.
Is this the case? That's a harder question to answer than the one about entire male and female populations. Many studies have quantified overall gender traits, but most aren't oriented toward the top 1%, or top 0.1%, of the population. That highest echelon may not be well known, based on existing research. If the second graph is representative, then the Google memo's conclusions are actually completely wrong. For that reason, caution should be used in applying general results to such an elite company as Google.
Other Data
Do I believe the Google memo's main premise is wrong? No, I don't. But, I'm also not confident. In the absence of better data, I'm willing to use the general population math data as a starting point. But, disclaimers about its applicability should be made, and the Google memo did not do that.
However, one reason I think the upper tail data would likely still show an expected male advantage in math is that we do have more sophisticated statistics available for IQ. Whether math scores or IQ are better predictors of ability at a software company is another question. However, IQ results do suggest that while male and female average IQs are similar, the distribution of male IQ is such that at very high levels of IQ, males are disproportionately well-represented. If math or other software skills mimic IQ, then the memo's premise may hold.
As one more simple data point, I tallied the entire graduating class of Caltech for 2017. Caltech has the highest SAT scores among US colleges, and is almost exclusively STEM majors. Therefore, it may help better characterize the "upper tails". I used the commencement program to count students with relevant degrees. For this, I counted any of the majors with "comput" in their name, and also minors, so long as the student's major didn't indicate another likely career choice. For example, a "physics major, computer science minor" was counted, while a "biology major, computational neural systems minor" was not.
Among the students with majors likely desired by a software company, women comprised approximately 27% of the graduates. This is compared to about 40% of the graduating class overall, suggesting women may be choosing, or excel at, other STEM majors more than computer fields. The Caltech class at 27% female, however, is higher than current US averages of 18-20% female, in "computer science" majors. This could mean that in fact, although more men would still be expected near the upper tails, the distributions are skewed at those upper tails to narrow the gender gap shown among the broader population (where women make up less than 20% of computer science majors).
One problem with Caltech is its extreme small size, so to be useful, this same tally should be performed for several years running. Nevertheless, without considering upper tails, Google's current ratio of female IT staff of 19% looks almost entirely expected. If the Caltech result is more representative of the upper tail, though, then perhaps we should expect closer to 27% female IT workers at an elite company like Google.
There are many other limitations to results in the Google memo, and my presentation here. I've only attempted to identify a couple strictly related to statistics. Neither are proper scientific presentations, but merely attempts to further a delicate conversation with the addition of some data.
The statements about Russian hacking and/or interference in the 2016 US election are getting louder. Is this because the evidence has gotten stronger? Or, was there insufficient skeptical pushback against these claims? Are there political motives in the US, especially on the left (and "neocon" right) to exaggerate Russian influence?
For the impatient, I will state up front that I know not who hacked the DNC, or Hillary Clinton campaign manager John Podesta. There's nothing in the evidence I've seen to support any conclusion. It's my opinion that any private sector individuals expressing confidence in the consensus view that Russia is to blame are not exercising reasonable scrutiny on this issue.
My background is in military surveillance, but not of the kind that directly applies here (I worked on so-called "spy planes"). I have no inside connection that affords me any insight not available to the general public. My profession is software engineer, which gives me better-than-average ability to assess the technical details presented in this story; but cyber security is not my specialty. I have done many things in my career, including significant reverse engineering. To that extent, I'm hacker-adjacent, but do not consider myself a hacker.
Technical asides for laymen are presented inline in blue. Skip them if you're familiar with the issue.
Concessions
Before delving into the details, I'll outline major concessions I'll make to the consensus view:
Russia has a motive to tip the election in favor of Donald Trump. This seems uncontroversial. Hillary Clinton had repeatedly advocated what can only be considered acts of war against Russia with respect to both cyber security and Syria. Donald Trump has loudly rejected those positions. It's clearly better for Russia to have a President Trump on those points alone. That does not mean there aren't many other actors with anti-Clinton motives as well.
The persona Guccifer 2.0 may not be who he says he is. I fully accept that inconsistencies in his statements indicate that he may not have the technical skills to have carried out this hack (alone). This also does not scream "Russia" to me.
There may be relevant information pointing to Russia that has not been released to the public. If this is the case, those suspecting Russia may be "right". In my opinion, it would still be for the wrong reasons. In matters that seem easily able to lead to escalation between two of the world's superpowers, I think the public needs to demand a high level of proof.
What Some Others Have Written
Here is a standard piece promoting the view that Russia did conduct these hacks:
What is a VPN? A VPN is a network setup for various security reasons. A VPN provides a boundary between computers inside it, and outside it. The boundary can generally be crossed, but mostly in one direction. A VPN might be setup for a whole company, to protect their employees' computers. What makes it "virtual" is that the computers inside the VPN need not be all on the same physical network of computers connected via network cables and Wi-Fi. This is useful, for example, if a company lets employees work on home laptops, while still having their computer protected as if it were inside the company's walls (and firewalls).
A VPN may also be useful if a person wants their computer to appear to be in a different location. This could be to fool computers elsewhere into thinking their computer is somewhere it's not. It could be to watch sports in geographic regions where access is denied (blacked out). It could be to purchase goods restricted for online sale to particular areas. There is nothing fundamentally shady about using a VPN, nor is it a particularly sophisticated tool that would indicate state-sponsored actors.
A VPN provider may utilize computers (servers) all over the world, to provide access to users all over the world, and also to give users the ability to make their own computer appear to be from a variety of locations. When a computer inside the VPN contacts a computer on the broader internet, from the perspective of the internet computer (web server, mail server, etc.) it looks like the communication is originating from the server maintained by the VPN provider. No details on what's happening inside that VPN are available to the outside.
The actual VPN server used in all of Guccifer 2.0's communications with the press was a French server. It's entirely normal for a Russian VPN provider to have servers based in France, and elsewhere.
Why is the VPN provider being a Russian company important? Honestly, I don't know. This doesn't seem like more than circumstantial evidence to me. This is of the flavor of "Edward Snowden is working with Putin because he fled to Russia", but actually much weaker. No, Snowden got stuck in Russia. Why would he choose Russia? Because it's one of a limited number of countries that he would know would not cooperate with US authorities looking to catch him. Russia may be the enemy of Snowden's "enemy", but that does not make them friends. In the Guccifer 2.0 case, this person(s) is attacking, in essence, the US government. Were he, for example to use a US VPN provider, it's entirely possible that the VPN provider would cave to pressure (possibly in secret) from the US government to reveal details that might uncover Guccifer 2.0's true identity. There is absolutely nothing suspicious in my view of someone, wanting to be anonymous with respect to the US government, using a Russian VPN service.
The homepage for the Elite VPN service does come up in Russian, but even the native Chrome browser can perform a pretty good translation into English with the press of a button. Elite VPN also advertises English language support. So, it makes no sense to me to assume that the hacker(s) must be Russian to use this VPN.
The ThreatConnect blog I referenced earlier makes some additional points. They point out that the specific IP address used by Guccifer 2.0's VPN is not an IP address available to the general public.
What is an IP address? An IP address is the network address uniquely identifying a particular computer. Actually, one computer can have multiple IP addresses if they're connected to multiple networks, but that's not an important detail. Think of an IP address as the internet analog of your phone number (you might have multiple phone numbers, too). Every computer on the internet has an IP address. Some are permanent (static), and some are temporary ones that change regularly.
There is nothing esoteric about IP addresses. They are as well-understood to computing professionals as telephone numbers are to everyone else. If you were blowing the whistle on the potential President of the United States, you probably wouldn't call the press from your home phone, would you?
ThreatConnect hasn't stumbled onto some deeply secretive data here. Anyone sophisticated enough to even use a VPN almost certainly knows that the reason they are doing so is to hide the true IP address (and therefore, location) of their real computer. Again, when communicating with the outside world, they will only see the IP address of your VPN service's server, not your computer's address.
So, let's assess the claim about Guccifer 2.0's VPN IP address not being available to the public. Is this true? I don't know. I haven't taken the time to sign up for Elite VPN myself. Someone could try, and see if 95.130.15.34 is available as a choice on Elite VPN's user website. But, even if it's not, I see multiple explanations for that:
That IP address used to be available, and was removed recently. Internet hosting providers change their servers' IP addresses constantly. Try looking up the IP addresses for common websites you use (by their domain name), and do it again in a few hours/days/weeks. The numbers change ... much more frequently than companies change phone numbers.
Depending on where you (the VPN user) live, Elite VPN gives you different choices for which VPN server you'd like to use. This could make sense to optimize performance, and balance traffic among their global userbase. Did ThreatConnect check which VPN server IPs were available from their own computers (in the US)? From their computers, themselves using a VPN? From France? From Romania? I didn't see that information.
I would love for someone to explain why these previous two explanations don't seem exceedingly plausible. This is important, because much of ThreatConnect's subsequent arguments hinge on this point: that Guccifer 2.0's VPN server was not a publicly available one. Why is this crucial? Because they go on to list other supposedly incriminating activity that originates from 95.130.15.34. Normally, all of the users inside a given server's VPN (e.g. that of 95.130.15.34) would be viewed as the same by the rest of the internet. Bob and Joe, if both using the 95.130.15.34 VPN, would appear indistinguishable from the perspective of internet web servers, mail servers, etc. So, if this was in fact a publicly available Elite VPN server, none of the other activity that appears to originate from 95.130.15.34 can be confidently attributed to Guccifer 2.0, or Guccifer 2.0's colleagues. They could be activities of any user who picked that same VPN server (or was assigned it by the service provider).
And, let's be clear. There are lots of shady users who choose VPNs to hide their tracks. If this was a publicly available VPN server, then other activity coming through that server is no more attributable to Guccifer 2.0 and friends than a list of crimes that were also committed by people in my ZIP code, or phone area code, are attributable to me.
It is from one of these associated IP addresses that the domain name fr1.vpn-service.us is looked up. ThreatConnect then goes on to elaborately make the case that the (publicly visible) domain registration information for that domain name is now listed as an American in New York, but in 2004 was the same "American" from New-Yourk (ZIP code 35555). The registration email address from that 2004 listing is supposedly sec.service@mail.ru. The plot thickens!
No, it doesn't. Simply by knowing the domain name fr1.vpn-service.us, we know that it belongs to vpn-service.us. Visiting that website (as we did above) takes you directly to a page that makes quite clear that it's a Russian service. There's no subterfuge here. Are we to believe that Russians are trying to hide their association with fr1.vpn-service.us, despite the root site vpn-service.us advertising in full view that Russian is their primary language? This doesn't pass my smell test.
The supposedly covered tracks from the 2004 domain registration not only contains cartoonishly bad spelling and ZIP code errors, but lists the contact address as "sec.service@mail.ru"? The Russian FSB is the Federal Security Service. This would be like our NSA registering a domain in Russia and putting nat.sec@aol.com as their contact address. This frankly strains credibility. Again, the vpn-service.us domain name is clearly operated by a Russian VPN provider. This detail of a 12 year old public domain registration record with ridiculously fake American info and a Russian email address seems likely to be one of two things:
This is an FSB operation, and those conducting it are complete idiots
This is anti-FSB propaganda, designed to be read by laymen who won't closely inspect details
When assessing the likelihood of either, I find it less likely that state-sponsored actors from a country with high technical sophistication are complete idiots, and more likely that US-based propagandists are relying on only gentle scrutiny from a public that has shown itself to be easily baited into supporting militarism.
Or, maybe, it is FSB and they're hoping to elicit my exact reaction: that this probably isn't FSB, because FSB can't be that stupid. Possible. But, now we're firmly into the territory of "I have no idea who did this".
Finally, we see ThreatConnect associate other shady (or just Russian) activities with the Guccifer 2.0 95.130.15.34 address, such as Russian bride scams, password hacking, and ... gasp ... using cryptocurrency (like Bitcoin). Again, this is meaningless if other people are allowed to use that same VPN. No reason to suspect association with Guccifer 2.0. And, even if it is? My favorite is the reference to the EDR Coin cryptocurrency. Are we to believe that one of the world's largest petro-states prefers that when its agents use digital currency to hide their tracks, they use the cryptocurrency that is environmentally friendly? (Bitcoin is not environmentally friendly, by the way). Somehow, I suspect Jill Stein is soon to be implicated in this plot! (sarcasm)
This all seems like a hodgepodge of circumstantial evidence built on conjecture blended with a combination of false flags and hilarious direct Russian references. How can anyone draw confidence from this jumble?
2. Guccifer 2.0 and Metadata
Another main point of this argument is that one of the documents leaked by Guccifer 2.0 shows details of being viewed/edited by a Russian.
What is metadata? For a computer document, these are details about the document itself, not about the topic the document is dealing with. Typically, the metadata would include information about computer language settings, the name of the author, or last person to modify the document, a timestamp for creation/modification, etc. This is not highly hidden data. Depending on your operating system, you can find this data either by right-clicking a file and choosing Properties; or on a Mac, Get Info would show you metadata. Inside a program like Microsoft Word, there may be additional metadata for a document.
The report is that one of Guccifer 2.0's documents shows ownership (or modification) by a Russian. But, not just any Russian. Felix Dzerzhinsky, the founder of the Soviet Union's secret police. Now, as a flaming atheist, I cannot endorse any theories that involve Felix (who is long since deceased) being involved himself! But, does this even make sense that it would be a Russian agent? Do US operatives set the login information (which determines the default metadata on new files) on their computers to use the username "J. Edgar Hoover"? Again, this seems like a joke. As a hacker-adjacent person, I know that such people love to leave slightly-hidden jokes in their work, in the hopes that one or two people with their level of knowledge laughs at the same arcane reference. This looks like a joke to me. Not even someone who wants the US authorities to think it's Russia. That's still too obvious. Someone who is literally mocking US surveillance state types, and the ease with which they can be made to jump at existential boogeymen.
I'm also skeptical of the idea that this metadata was left accidentally. I know readers may be learning about file metadata for the first time. But, it's not an esoteric topic. It's about as well-known among hackers as those IP addresses. In fact, even with my barely anonymous Twitter account, I take steps to remove metadata from files I post that are connected to my account. Here's one, done months ago. Download the file. Look for the metadata. Again, to assume that this was left accidentally and was also done by Russian agents is to think they're complete idiots ... who also have a sense of humor (?) about secret police history.
3. US Intelligence Community
In addition to private sector cybersecurity groups like ThreatConnect and CrowdStrike, the US Intelligence community itself is cited as evidence that Russia is the culprit here.
I'm not sure I've seen another claim by Politifact that they rate true, which was so obviously false (or some grade of not true). Here are the US Intelligence Community agencies (and there's the overall supervising Director of National Intelligence office itself).
In my capacity as a defense contractor, I've worked with (not for) at least 3 of those agencies. I simply don't believe all of them would even offer an opinion on the question of whether Russia conducted these hacks. It's a Republican talking point that the government is made up of dozens of redundant agencies. In fact, these agencies do different things. They're not all involved in cybersecurity investigations.
The Coast Guard Intelligence offered an opinion on whether Russia conducted these hacks? What does this have to do with the Coast Guard? NGIA is an agency that provides detailed map data (some of it, classified) to other military programs. How does this case have anything to do with them? The National Reconnaissance Office is responsible for airborne and spaceborne surveillance (satellite spying). FBI is one of the 17 agencies, and reportedly did not want to publicly endorse this statement.
The statement was remarkably brief, but pundits have turned it into much more. The key words, in my mind, were
The recent disclosures of alleged hacked e-mails on sites like DCLeaks.com and WikiLeaks and by the Guccifer 2.0 online persona are consistent with the methods and motivations of Russian-directed efforts.
What this sounds like to me is the following conversation between a manager, and subordinate, in the intelligence community:
(M)anager: The political climate is getting tough right now. They want us to provide a statement about Russia hacking the Democrats.
(S)ubordinate: But, we don't know who hacked the Democrats.
M: Yeah, they're not going to settle for that, right now. Is there anything that we can say about it maybe being Russia.
S: Sure, it could be Russia.
M: Still not strong enough. We know they have a motive here, right?
S: Ok, yeah. Clearly.
M: And, they could have conducted the hack in exactly this way, as we think they've done in other cases?
S: Sure, this hack looks just like a lot of other hacks.
M: So, we could say that this is "consistent with the methods and motivations of Russian-directed efforts"?
S: Well, that's pushing it, but I guess is technically true.
M: Ok, then.
That's just my take. The Podesta hack in particular seems to have been conducted against an aging man who hasn't a clue how to conduct electronic communications securely. The Wikileaks dump indicates not only that Podesta fell for a phishing scam, but that his IT person did, too! Even if you're inclined not to believe the Wikileaks emails are authentic (despite none of them being proven to be fakes), we know that Podesta's iCloud and Twitter account were hacked this year as well.
What is phishing?Phishing refers to a category of scams where the attacker pretends to be someone, or some group, that you trust. They convince you to give your information to that group, after which the attacker will use that information to steal something of value to you. The most popular variant of this is an email to you that claims to be from your email provider (Google, Yahoo, Hotmail, etc.) or your bank. They claim there's a problem that requires you login to your account to address. They offer you a link that takes you not to the real bank/email website, but to an attacker's website, that has been designed to look exactly like the real one. You enter your username and password into this (fake) website's authentication form, and they now have the credentials needed to login to your real account. At that point, your money or email may be stolen. You should familiarize yourself with this attack. I literally get them every day. Once you learn two or three things, they're easy to defeat.
In other words, John Podesta's computing security is appallingly bad. Anyone could have hacked him. Therefore, the statement that this was "consistent with methods" could be applied not only to Russia, but any other group conducting hacking operations. Podesta appears to have fallen for the most basic of all scams. I see no indication that nation-state-level sophistication was required here. Drumming up stories about Russia provides some cover for what should be an embarrassment, not only for Podesta, but for the Clintons, who've themselves been lax with their own computing security.
US Propaganda
Finally, we need to tackle the elephant in the room. This exceedingly looks to me like members of the US government, and/or supporters of Hillary Clinton, are themselves guilty of influencing the public with false propaganda. As near as I can tell, they've done so with considerably greater reach and effect than Russia.
(to be continued)
References
Here are some of the documents I used in assessing these claims:
In the wake of Hillary Clinton's loss to Donald Trump, it's worth considering whether Bernie Sanders would have suffered the same fate. During the primary, I pointed to historical polling of party nominees during the primary season, and how well it predicted final general election results:
At the time, there were two major sets of polling data available to help assess the candidates. First, individual candidates' favorability ratings. Second, we had general election matchup polling of several potential November matchups.
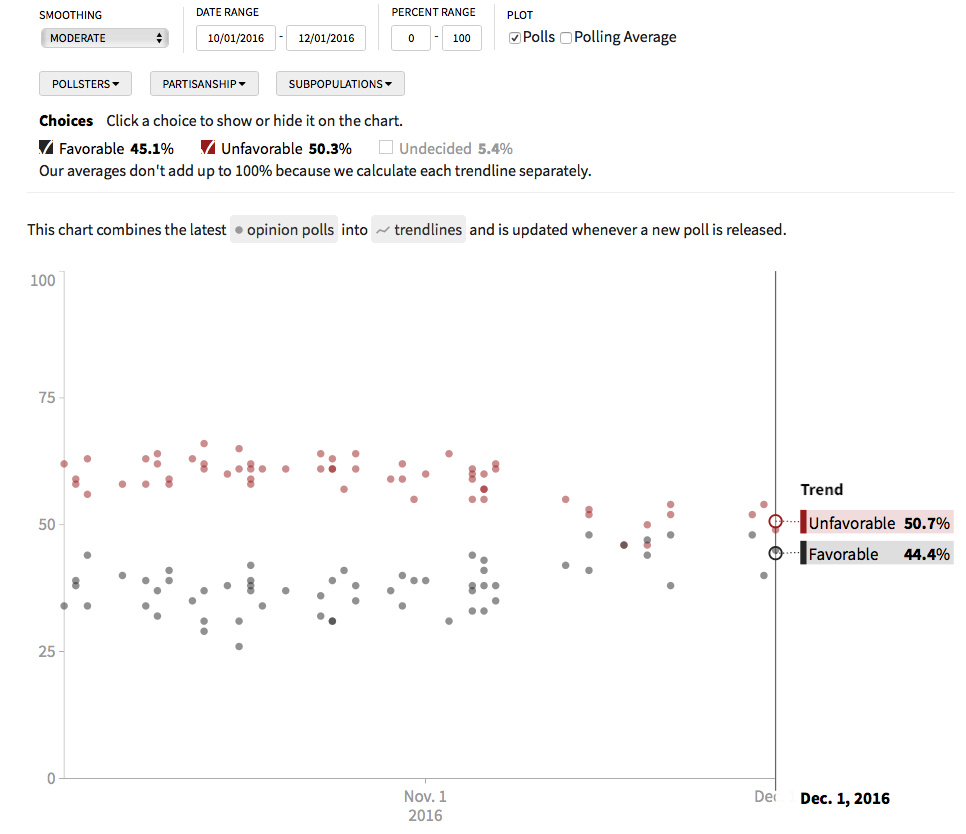
In the favorability ratings, Bernie Sanders far exceeded Clinton, who noticeably exceeded the ratings of Donald Trump (June 6 ratings in parentheses):
In matchup polls, the final polling conducted between Sanders and Trump (end of Sanders' realistic chances to win nomination) showed Sanders performing at an average of +10%, which is an enormous margin in modern electoral terms:
It's important to compare apples-to-apples while the Sanders-Clinton race was still in progress. After it ended, Clinton predictably got a large, but short-lived polling boost (as did Trump earlier in the season). Depending on how you average/smooth the data, the Clinton-Trump matchup polls gave Clinton between a +2% and +4% advantage at that time. So, conservatively, Sanders fared about 6 points better than Clinton in that future matchup.
Are all these early data meaningful? I believe so. Here is an analysis of primary season polling data as a predictor of general elections:
I draw some different conclusions than Silver, but I'm starting with the data he provides.
What this shows are the averages of favorability ratings during the primaries, and of course, the final results. In these 10 previous contests, 7 times the winner was the candidate who polled more favorably during the primaries. 7 out of 10 seems modestly, but not wildly, skillful. But, I believe the results are more useful than that, when inspected closely.
One of the 3 "failures" was the 1988 Bush-Dukakis race. That was a failure. I will only note that unlike other candidates, Dukakis had excellent net favorability, while still having low favorable ratings. In other words, during the primary season, many respondents either had a neutral, or no opinion of Dukakis. In statistical terms, we have to consider this kind of data as lower confidence data. Dukakis and Bush had identical early 34% favorable ratings. But, by November, Dukakis's unfavorable ratings had risen from 16% to 39%. In any case, this race was a failure in terms of prediction skill.
However, the 1992 Clinton-Bush failure was different. While Clinton's early ratings were worse than Bush's:
Like Dukakis, many voters had not yet formed either a favorable or unfavorable view yet
They were only modestly worse than Bush's (-11% vs -3%)
Most importantly, the final race was impacted by an independent candidate winning 15% of the vote
This last point is crucial. A comparison of two early candidates cannot be expected to account for the effect of another candidate garnering 15% of the final vote, if that candidate is not siphoning exactly as many Democrat and Republican votes. It seems entirely plausible to me that Ross Perot allowed Clinton to win the 1992 election. Thus, I think we need to throw that year out, entirely, in our analysis.
The last failure was the 2004 Bush-Kerry race. But, I submit that this wasn't a failure at all, rather an indication of the closeness of the race. Early polling showed Kerry at +1% and Bush at -1%, the smallest early season difference in the last 40 years. In the end, Bush won the vote by 1%. So, while early polling did not successfully predict the winner, I think it's fair to say that it did predict the outcome, within a very modest range of uncertainty. In statistics, that needs to be the standard. Barely missing is not equally bad as missing by a large margin. I argue that 2004 should be considered a success of this predictor, with the caveat that a couple percentage points of uncertainty has to be assumed. This, then, would mean that in 8 of the last 9 elections without large 3rd-party influence, primary season favorability ratings were a good predictor of outcome.
8 out of 9, or even 8 out of 10, has to be considered very good performance. This year, the gold standard of political poll analysis, FiveThirtyEight.com, had Hillary Clinton at >70% to win the election, on the very day of the election. They ended up missing on the popular vote by a modest 2%. We don't have any means of quantifying electoral chances that's without uncertainty in the results.
That quantifiable predictors are not perfect is not a good reason to favor more qualitative analysis. It's only a good reason to be less certain about the predictions.
Questions
Q: But, if we're to believe that favorability rating is a good predictor, why didn't it predict Sanders beating Clinton?
A: I don't claim that favorability is a means by which to predict primary races. There are two unique factors affecting primaries. First, name recognition. Primary voters must choose between less well-known candidates. By November, both major party candidates are always well-known. In primaries, those with high familiarity (e.g. Clinton) have a huge advantage. This is why we often see party nominees who were "losers" in previous years' races. Secondly, at the national level, we have a close left-right split of the electorate. In that environment, I believe personal favorability has the opportunity to be a deciding factor. In primaries, there is no clear center-point of the party. No symmetry to be slightly tipped in one candidate's favor by good favorability ratings.
Q: What about 2000? Isn't that a "failure" because Gore actually won the popular vote?
A: That's an entirely fair reading. But, then, we could also consider 2016 a success because Clinton won the popular vote. In any case, I think 8 out of 10 successes is a reasonable interpretation of the history of this heuristic.
Q: But these polls were so far in advance? Wouldn't things change by November?
A: Of course, they could. But, the final polls were conducted in June, only 5 months from the election. Clinton and Trump are also well-known quantities. Their favorability ratings were very consistent throughout the election season. Sanders is the least well-known of the three. His numbers may have changed. But, the point is that they would have to change by a tremendous amount in 5 months. His (favorability/matchup) numbers weren't just better than Clinton's in June. They were much better. And, Sanders' favorability ratings did not mirror Dukakis's in 1988, where large numbers of voters expressed no favorable/unfavorable view in the polls.
In the end, the data show that, historically, things usually don't change that much from June to November.
One of the best things about posting ideas online is exposing them to a community to be challenged. You also record a snapshot of your thinking at a given time, which can later be revisited. This should serve as an opportunity to calibrate your judgment and evaluate your analyses. Here's an opportunity to do that with a claim I made last week:
This tweet was in reference to the James Comey (FBI) announcement on 10/28 about the discovery of new emails, possibly related to the previously-closed Clinton email investigation. My tweet claimed that the announcement would surely not change polls by 1%, persistently. To be clear, I was referring to the net margin between Clinton and Trump, which at the time, stood at approximately 4%. Thus, I was claiming that the event would not cause polls to drop to 3%, favoring Clinton. It should also be clear by the "hiccups" clause that I was making no statements about the possibility for short-term effects on polls, as voters scrambled to understand the meaning of the Comey release. Granted, I offered no specific clarification about what "persistent" meant, but in the context of an election that was only 11 days away, I intended the claim to pertain to the polls as they stood before the election.
Results
As the election is still 4 days away, I actually don't think it's necessary to judge the prediction at all today. I consider less than a week still within "hiccup" territory, and many pollsters' latest results still include polling from the day of this news release, when voters may have been caught in the confusion of politicos spinning this story. Nonetheless, let's evaluate it today. I will be happy to admit failure and publicize it as such, should election day come and the prediction not have been validated.
Measuring
To assess my claim, we need a measure of the polling today, and a baseline before the Comey letter. I've consistently referred to rolling poll averages at RealClearPolitics.com, because their math is straightforward and the source data is well linked.
I consider 4-candidate polls to be the proper measure, as in almost all 50 states, it will actually be 4 (or more) choices before voters. A 1% effect on polling can't be evaluated without the effect of 3rd-parties.
The results today (updated as new polls come in) show Clinton with a +2.4% margin. This is the easy part. The more difficult part is establishing a baseline. I anticipated I might need to back up this claim in the future, and actually tweeted about the (then) current polling immediately after the Comey letter:
following that up by noting that at that time, the RCP moving average (Clinton +3.8%) included no polling data collected after the FBI letter was announced.
So, this is clear, right? Polls at +3.8% before the event, and +2.4% afterwards? I was wrong? Well, maybe. Again, I think the jury is still out (until Tuesday), but there's also a couple points to consider:
What is our Baseline?
10/28 is clearly reflecting data before the event. But, what about the average on 10/29? Looking closely, we see a huge jump in Trump's numbers between 10/28 and 10/29:
Is that jump due to the Comey letter? Almost certainly, mostly not. It's important to understand that RCP's moving average is not showing the sentiment of American voters on a given day. It's an average of the most recent polls that have been released before that day. Expanding the individual poll summaries below the chart, we see that RCP averages approximately 5 days' worth of polls, typically between 5 and 8 polls' worth.
On 10/29, I believe their moving average was calculated from these 7 polls, judging by the average:
I say "I believe," because a simple average of these polls gives Clinton +2.7%. Hovering over the graph, however, shows +2.6%. So, I can't say for sure. But, it's possible that either:
RCP applies different weighting to polls based on sample size or margin-of-error. The two biggest polls in that group were both Clinton +1%, so that might explain a slightly lower result
It may be that RCP is only displaying results to the nearest percent on their webpage, and have finer-grained data to calculate the overall results. So, 2.6 vs 2.7 may be due to rounding.
But, doesn't the 10/29 moving average include the Comey event? Barely at all. Only 1 of those 7 polls continued into 10/28. That was a 6 day poll. If we assume equal spread of polling in the IBD/TIPP poll, only 169 voters could possibly have known about the Comey letter. This is a generous estimate, given that many were likely at work on Friday, or otherwise didn't hear about the event until after participating in the poll. In any case, 169 voters represents only 2% of those polled, in the 10/29 RCP moving average. So, why the big Trump jump from 10/28 to 10/29?
Almost certainly, this is a result of a block of very good poll results for Clinton from 10/24 now being 5 days old, and no longer in the average. Dropping results of +9, +9, +9, +14, +1, and +4 for Clinton was guaranteed to significantly reduce this moving average between 10/28 and 10/29. This aspect had nothing to do with the FBI letter.
This underscores an important point: Clinton was already losing ground quickly, before the FBI letter was released. From the data, her biggest margin of +7.1% came on 10/17. By 10/28, it was down to +3.8% with zero influence from the FBI letter. By 10/29, with results including only ≈2% of respondents from Friday 10/28, the margin was down to +2.6%
So, what is the best baseline? Well, there's probably no perfect answer. 10/28 has no post-FBI data in it. But, it does still carry the effect of 4 really good Clinton polls (+9,+9,+9,+14). 10/29 only has about 2% of its data coming from after the announcement.
The entire 10/28-10/29 gap in margin (+3.8% - +2.6%) can be explained by the removal of the 10/24 polls. In order for the limited amount of Friday the 28th polling to account for that difference would require those 169 voters to have chosen Trump by a ratio of 4:1. That's nearly impossible. Even a 55/45 split can't be supported by the polls conducted since that date.
So, I feel comfortable with the assessment that 10/29 is actually the best baseline. With that baseline, the change in polling is now down to only 0.3%. The selection of start date literally makes the difference between my prediction looking right (well under 1%), or wrong (assuming we evaluate it today at all).
Where Did the Votes Move From
The second interesting thing in the RCP moving average data is that Clinton's total did not drop at all, whether you use 10/28 or 10/29 as the start date. Jill Stein's numbers didn't change at all. It doesn't appear that the left, broadly, had any change in opinion based on this announcement.
The entirety of the difference in polling in the last week is Gary Johnson losing ground, and Trump gaining it (mostly the latter). Are we really to believe that bad news for Hillary Clinton caused Gary Johnson voters to shift their votes to Trump?
What seems more plausible to me is that Gary Johnson has been on a continual slide for nearly 2 months (as has Stein to a lesser degree). Johnson had a bad last week: his faux marijuana heart-attack and VP Weld's semi-endorsement of Clinton both likely lost him moderate Republican followers.
TL;DR
Was I right or wrong? Maybe. I still submit that it's too early to tell. I'll revisit this prediction on election day, when I'm hopefully not celebrating a Trump victory. And, hopefully improving on my early primary prediction of Marco Rubio being the GOP nominee. 😉


